Comprehensive (Full‑Dimensional) Analysis of Water Quality Ammonia‑Nitrogen Monitoring
Ammonia Nitrogen (NH₃–N): A “Hidden Boss” in Water Quality
Although invisible, ammonia nitrogen exerts significant influence over water quality. It originates from many sources—agriculture, domestic, industrial, natural—and its presence can be a double-edged sword. Aquatic life in natural environments needs some ammonia nitrogen to survive, but high levels can poison or kill fish. Its concentration fluctuates with seasons, weather, pollution sources, and more.
I. Broad-Spectrum Sources of Ammonia Nitrogen
Agricultural Activities
Fertilization: Nitrogen in fertilizers (e.g., urea, ammonia solution, NH₄NO₃) can be released as ammonia, then washed into water bodies by rainfall or irrigation, raising NH₃–N concentrations.
Animal manure: Livestock and poultry operations produce nitrogen-rich waste that enters water systems via field runoff, groundwater infiltration, or rainwater wash-off.

Domestic Sewage
Household discharge: Wastewater containing proteins or amino acids (e.g., kitchen, washing water) is partly converted to ammonia nitrogen during sewage treatment, entering natural waters.
Decaying organic matter: Urea, amino acids, and other nitrogenous organics from daily life (e.g., urine, bathing, food scraps) biodegrade into ammonia nitrogen.

Industrial Effluents
Chemical, paper, food-processing industries: Contain or produce nitrogen compounds; untreated discharge elevates NH₃–N in water.
Gasification and steelmaking: Release ammonia gas that ends up increasing ammonia nitrogen levels.
Natural Sources
Decomposition of flora and fauna: When organisms die, their organic nitrogen is decomposed by microbes to produce ammonia nitrogen.
Precipitation: Atmospheric nitrogen oxides convert to ammonia or nitrates in rainfall, entering water bodies.
Internal Water-Body Release
Sediment release: In eutrophic waters, microbial decomposition in sediments releases NH₃–N—especially under hypoxic conditions.
Weakened self-purification: In polluted environments, reduced self-cleaning leads to ammonia nitrogen accumulation.
Climatic and Environmental Influences
Temperature and pH: Elevated temperature or pH increases NH₃ volatilization, altering ammonia nitrogen levels.
Organic pollution: Organic contaminants decompose into ammonia nitrogen, especially in eutrophic conditions.
II. Dual Nature: Benefits Versus Risks
A. Beneficial Aspects
Ammonia nitrogen acts as a nutrient, stimulating algal productivity. Appropriate levels support aquatic ecosystems, particularly in eutrophic lakes or reservoirs, by promoting plant and algal growth.
B. Harmful Impacts
Human Health
Ammonia nitrogen can convert to nitrite (NO₂–), which may combine with proteins to form carcinogenic nitrosamines in drinking water.
Ecological Risks
Toxic to aquatic organisms—especially fish; contributes to eutrophication, oxygen depletion, and habitat degradation. Toxicity increases with higher pH and temperature.
Water Quality Alterations
Raises pH due to its weakly alkaline nature, degrading water quality.
III. Dynamic Behavior
Seasonal Variations
Concentrations spike during spring–summer farming irrigation and industrial discharge peaks.
Sudden Events
Heavy rain, pipeline leaks, or industrial accidents can cause abrupt NH₃–N surges—necessitating high-frequency, continuous monitoring.
Periodic Patterns
Fluctuations tied to wastewater treatment aeration cycles or tide stages; time-series analytics are essential to predict trends.
IV. Advanced Monitoring of NH₃–N
To accurately track ammonia nitrogen in water, strategic deployment of sensors is essential—upstream of water intakes, downstream of industrial outlets, junctions of streams, etc. Monitoring points are carefully selected based on flow patterns and pollution sources.
A. Sensor Technology
Digital Ammonia Nitrogen Sensor ZWIN-NH3-N1006
The ammonia nitrogen sensor uses an ion-selective electrode and has a membrane with a specific type of ion permeability. The composite sensor composed of this selective membrane and electrolyte can be used to measure the redox potential of the required specific ions (for example, NH4 +).
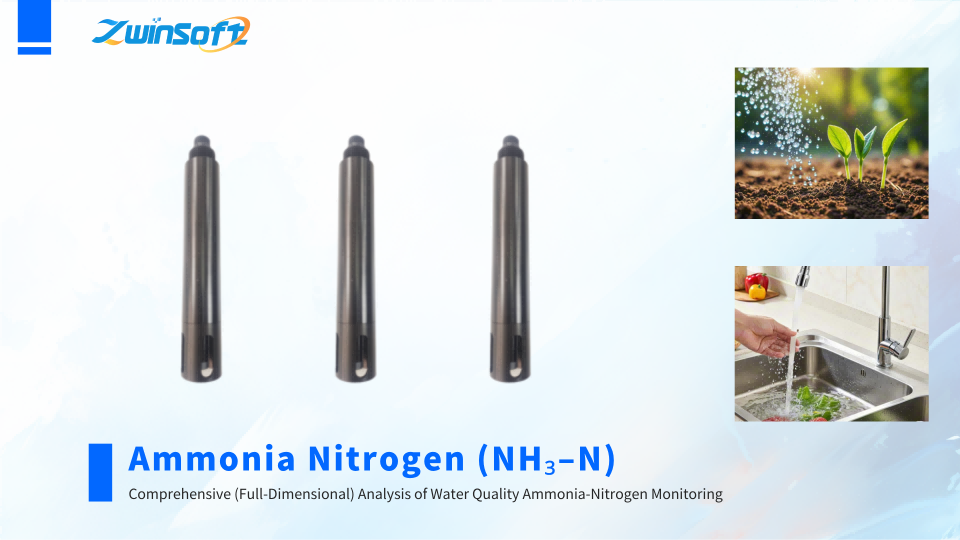
Application fields: sewage treatment plant treatment process and discharge port water quality monitoring, industrial process water quality monitoring, surface water/groundwater monitoring, other industrial wastewater treatment process and discharge port monitoring installations, etc.
- Measurement principle: ion selective electrode method;
- Measuring range: 0.1~100mg/L;
- Accuracy: ≤10% of the measured value or 0.1mg/L, whichever is greater;
- Resolution: 0.1mg/L;
- Repetition rate: <0.1mg/L;
- Drift: <0.3mg/L;
- Temperature compensator error: <0.1mg/L;
- Response time: <15s;
- Working temperature: 0-50℃;
- Sensor size (DxL): ф34X225;
- Housing material: POM;
- Protection level: IP68, 6bar;
B. Placement Strategies
Sensitive Area Coverage
Fixed station within 1 km upstream of intake to guard against sudden pollution.
Real-time point ~200 m downstream of industrial discharge outlets for source identification.
Layered Monitoring
In lakes/reservoirs: vertical profiling to capture stratified ammonia nitrogen dynamics.
Mobile Monitoring
Portable units at tributary inlets, confluences to fill gaps not covered by fixed stations.
V. Application Domains
Natural Water Quality Monitoring: Tracks rivers, lakes, reservoirs, urban potable and industrial water supplies to detect pollution early.
Wastewater Treatment: Monitors ammonia-nitrogen removal to ensure treatment effectiveness and regulatory compliance.
Aquaculture: Keeps ammonia nitrogen in check for fish and shrimp health, enhancing productivity.
Industrial Effluent Management: Ensures effluent meets standards, optimizes treatment efficiency, and reduces costs.
Regulatory Oversight: Remote data transmission enables environmental authorities to detect and respond to pollution events swiftly.
Scientific Research: Provides essential data to study aquatic biogeochemical cycles and water-resource dynamics.
VI. Multifactor Integration & Alert Triggers
A. Key Correlated Parameters
Dissolved Oxygen (DO): Nitrification consumes DO; if DO < 2 mg/L, nitrification stalls and NH₃–N may accumulate.
pH & Temperature: pH > 8 increases toxic free NH₃; every 10 °C rise doubles nitrification rate—monitor treatment performance in summer.
Chemical Oxygen Demand (COD): High COD fosters heterotrophs which compete with nitrifiers for DO, complicating NH₃–N removal.
B. Anomaly Patterns
| Anomaly Type | Characteristics | Typical Scenario |
| Continuous exceed. | >1.5 mg/L for 3+ days without decrease | Industrial leak or sewage pipe failure |
| Intermittent spikes | Single-day jump (e.g., night >5 mg/L) | Intermittent discharge or treatment plant load shifts |
| Sensor drift | Long-term near detection limit (0.02–0.05 mg/L) | Sensor clogging or calibration expiry |
C. Key Drivers of Anomalies
External inputs: Agriculture, industry, domestic sources (>70%)
Equipment/maintenance failure: Sensor fouling, reagent expiry, comms loss (~40%)
Process imbalance: Insufficient aeration, short sludge age, C/N ratio mismatch
D. Rapid Troubleshooting Steps
Validate Data
Compare readings from data logger, analyzer, control platform; a >1% deviation signals anomaly.
Check historical trends to rule out seasonal or periodic patterns.
Field Inspection
Examine sampling equipment for backflow dilution or bypass discharge.
Check instrument status: range settings, calibration logs, standard curve validity.
Source Tracing
Use hydrological models to trace pollution pathways upstream.
Deploy mobile monitoring teams to grid-sample suspicious areas.
 Tianjin Zwinsoft Technology Co., Ltd
![[Case Study of Water Quality Online Monitoring System] [Case Study of Water Quality Online Monitoring System]](https://fr.zwinsoft.com/wp-content/uploads/2025/12/微信图片_2025-12-22_095808_084-副本-150x150.png)


您好!Connectez-vous